A few years ago, my neighbor got fed up with rising electricity bills. Every summer, the air conditioner pushed his monthly bill over $200, and he dreaded the next rate hike announced by the local utility company. Then he installed rooftop solar panels. Fast forward to today—he’s producing most of his own power, his bills have dropped dramatically, and he even sells excess electricity back to the grid in some months. Stories like his are becoming increasingly common as solar technology matures and costs continue to fall.
In this article, we’ll explore why solar power often proves more cost-efficient over time compared to traditional grid electricity supplied by government utilities or private companies. We’ll break down the numbers, look at long-term savings, and include clear comparison tables and insights into real-world performance as of 2026.
Understanding the Basics: Solar vs. Traditional Grid Electricity
Traditional electricity comes from a centralized grid powered by a mix of coal, natural gas, nuclear, and increasingly renewables. You pay a utility company (government-owned or private) per kilowatt-hour (kWh) consumed, plus fixed charges, taxes, and fees. Rates fluctuate with fuel prices, infrastructure upgrades, and regulatory changes—often trending upward due to inflation and rising demand.
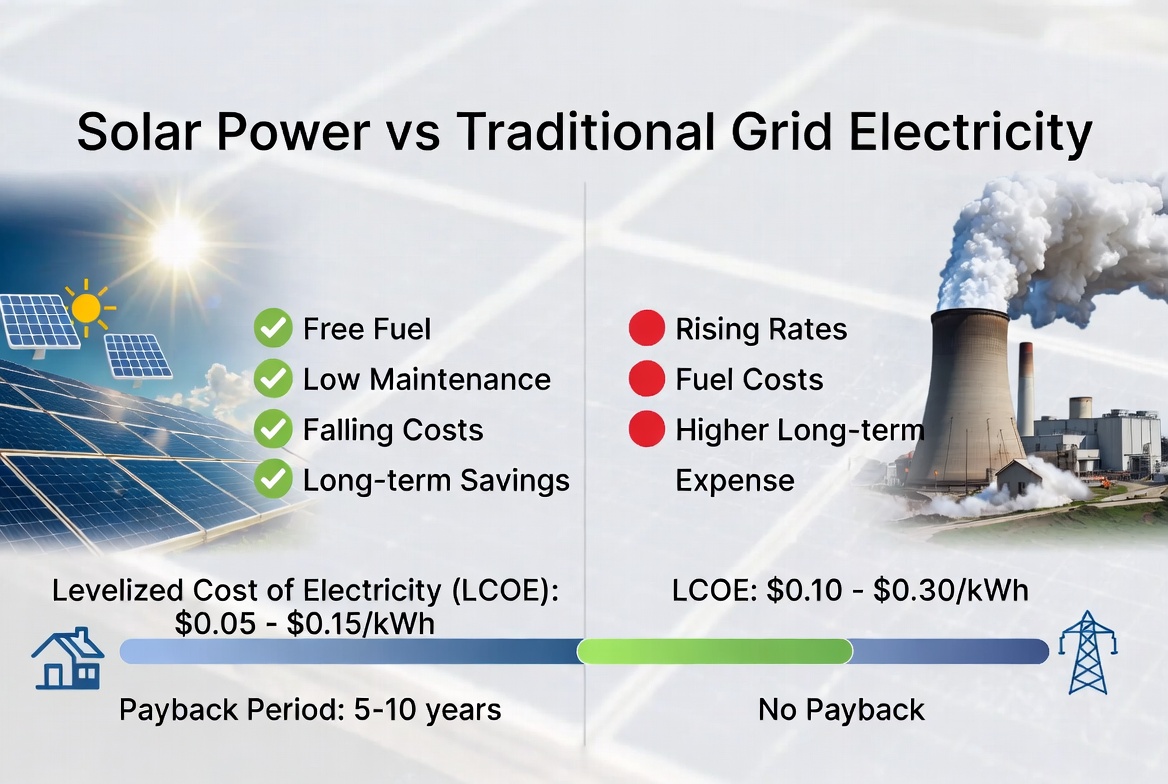
Solar power, on the other hand, lets you generate electricity on-site (rooftop, ground-mount, or community solar). After the initial investment, sunlight is free. Panels have no fuel costs, minimal maintenance, and warranties lasting 25+ years. The key metric for comparison is the Levelized Cost of Electricity (LCOE)—the average cost per unit of electricity over a system’s lifetime.
Solar’s LCOE has plummeted in recent years. Utility-scale solar now often ranges from $0.038 to $0.078 per kWh (unsubsidized), beating many fossil fuel options. With incentives, it drops even lower.
Upfront Costs vs. Long-Term Savings
The biggest hurdle for solar is the initial cost. A typical residential system might cost $20,000–$30,000 before incentives. However, federal tax credits (where available), state rebates, and net metering drastically reduce the net investment.
Once installed, solar slashes or eliminates monthly bills. Traditional utility rates keep rising—often 2-5% annually due to fuel volatility and grid maintenance. Solar locks in your energy costs at near zero after payback.
Real-world payback periods average 6–10 years for homeowners, depending on location, system size, and electricity rates. After that, you enjoy 15–20+ years of essentially free power (accounting for minor maintenance).
Detailed Cost Comparison
Here’s a side-by-side look at typical costs (U.S. averages as of 2026; actual figures vary by region):
| Aspect | Traditional Grid Electricity | Solar Power (Residential) | Notes |
|---|---|---|---|
| Upfront Cost | None (pay-as-you-go) | $20,000–$30,000 (before incentives) | Solar net cost often $14,000–$21,000 after 30% credit |
| Monthly Bill (Average Home) | $120–$200+ (rising) | $0–$50 (after payback) | Depends on system size and usage |
| 25-Year Total Cost (Est.) | $45,000–$75,000+ (with inflation) | $15,000–$25,000 (net after incentives) | Includes maintenance |
| Levelized Cost (LCOE) | $0.10–$0.25+/kWh (volatile) | $0.038–$0.078/kWh (stable) | Solar often cheaper long-term |
| Maintenance | Included in rates | Low (~$150–$300/year) | Panel cleaning, inverter replacement |
| Energy Independence | Low (subject to outages/rate hikes) | High (with battery storage) | Solar + battery adds resilience |
Example Household Savings Calculation (Average U.S. home using 10,000 kWh/year at $0.16/kWh):
- Traditional: ~$1,600/year → $40,000+ over 25 years (with 3% annual increases).
- Solar (8 kW system, net cost $18,000): Payback in ~8–10 years, then near-zero bills → Total savings often exceed $30,000–$60,000 over system lifetime.
For commercial or utility-scale projects, the advantage is even stronger due to economies of scale.
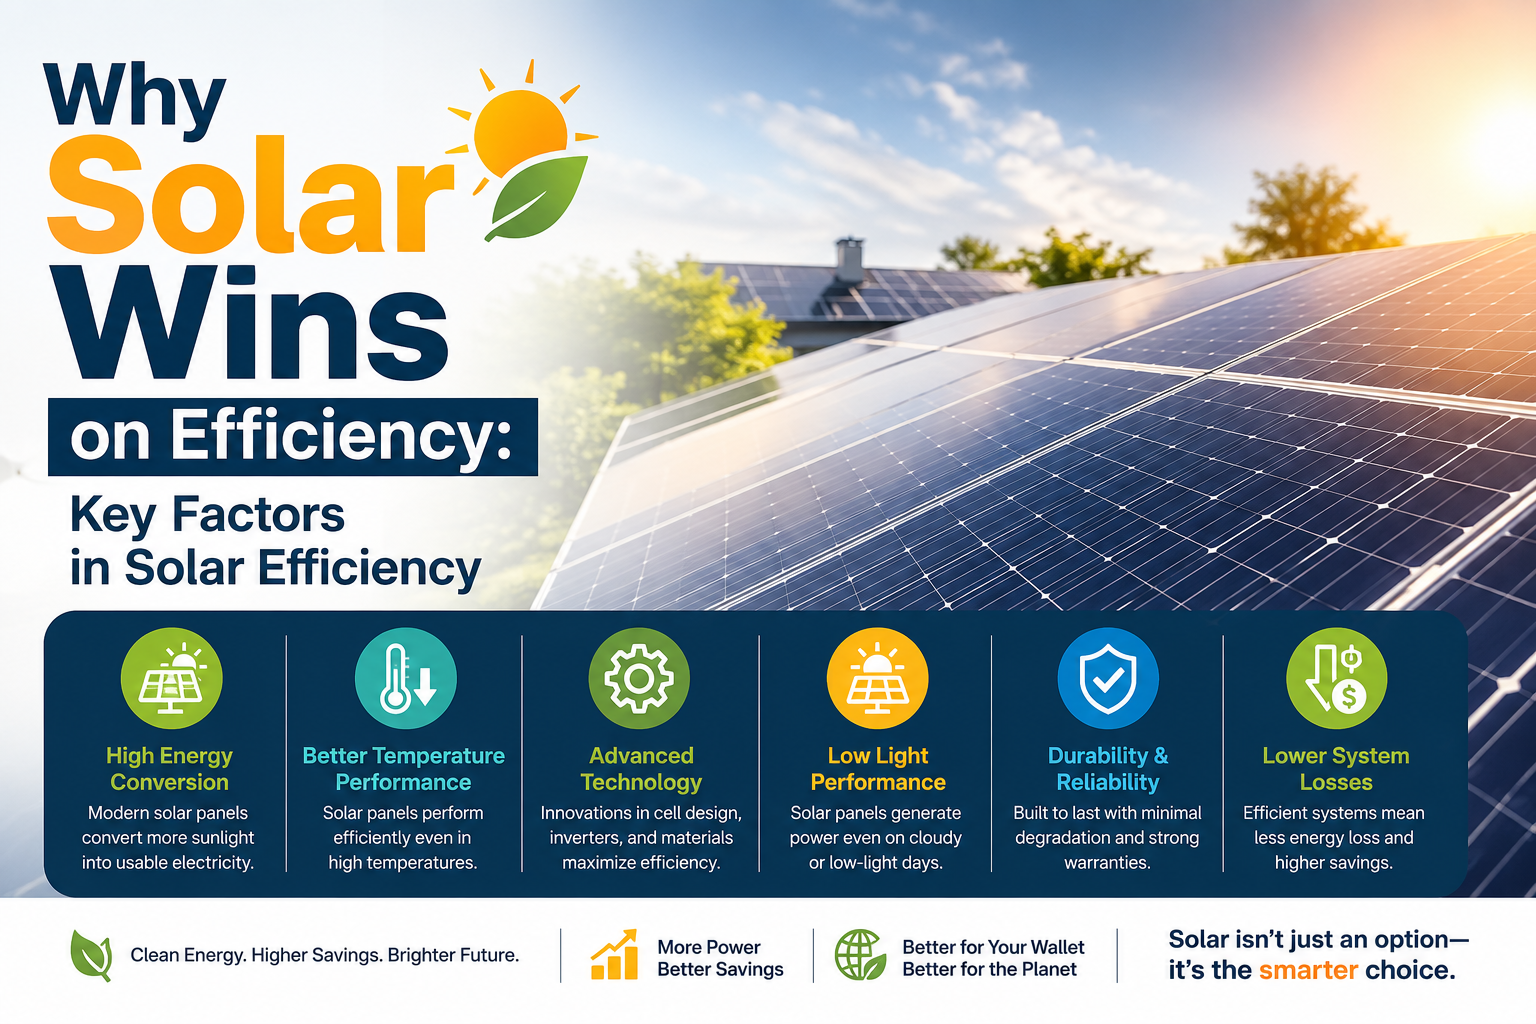
Why Solar Wins on Efficiency: Key Factors
- No Fuel Costs — Traditional plants rely on coal, gas, or uranium—prices swing wildly. Solar uses free sunlight.
- Falling Technology Costs — Panel prices have dropped dramatically. Efficiency improvements mean more power from less space.
- Incentives and Net Metering — Many regions credit you for excess power exported to the grid, shortening payback.
- Lower Operating Costs — Solar has no moving parts (unlike turbines or generators) and minimal maintenance.
- Avoided Rate Inflation — Grid rates rise with fuel and infrastructure costs. Solar hedges against this.
- Environmental and Hidden Costs — Traditional power carries pollution, health, and climate costs often passed indirectly to consumers. Solar avoids these.
LCOE Comparison Chart (2026 Estimates)
- Utility-Scale Solar: ~$0.04–0.06/kWh
- Onshore Wind: Similar low range
- Natural Gas Combined Cycle: $0.05–0.10/kWh
- Coal: $0.07–0.15+/kWh
Solar consistently sits at the lower end for new generation.
25-Year Cumulative Cost Graph
A line graph where the traditional grid line steadily climbs due to inflation, while solar shows a high initial point (installation) followed by a flat line near zero.
Payback Period by Region (Sample Table)
| Region/State | Avg. Electricity Rate | Typical Payback Period (Years) | 25-Year Savings (Est.) |
|---|---|---|---|
| High-rate areas (e.g., CA, NY) | $0.25–$0.35/kWh | 6–9 | $50,000+ |
| Average U.S. | $0.14–$0.18/kWh | 8–11 | $30,000–$45,000 |
| Low-rate areas | $0.10–$0.13/kWh | 10–14 | $20,000–$35,000 |
Challenges and Considerations
Solar isn’t perfect for everyone. Upfront capital can be a barrier (though loans and leases help). Shading, roof orientation, or poor net-metering policies reduce returns. Battery storage for full independence adds cost but is falling in price.
Weather dependency means you often stay connected to the grid as backup. However, hybrid systems with batteries provide excellent resilience during outages—something traditional grid users lack during storms or peak failures.
Maintenance is low but not zero—inverters may need replacement after 10–15 years.
Real-World Examples and Broader Impact
Homeowners in sunny states routinely report 70–90% bill reductions. Businesses and utilities are scaling up solar farms because they deliver cheaper power than new fossil plants. Countries and regions with high adoption see energy security benefits and lower import dependence on fuels.
Over time, as more homes and businesses go solar, grid demand during peak hours decreases, potentially stabilizing or lowering rates for everyone.
Conclusion: A Smarter Long-Term Choice
Solar power’s cost efficiency shines brightest over the long haul. While traditional electricity offers convenience with no upfront investment, its ongoing and rising expenses make it more expensive for most users over a decade or two. Solar shifts you from a perpetual payer to a producer, delivering substantial savings, predictability, and independence.
If you’re evaluating options, calculate your specific situation using local rates, sunlight data, and available incentives. Many homeowners find the switch pays for itself faster than expected—and then keeps paying dividends for years.
The sun is the ultimate free resource. As technology improves and prices continue trending down, solar isn’t just greener—it’s increasingly the smarter financial choice for powering our lives compared to traditional utility electricity.

Seraphina Vale is a passionate content writer and blogger with 3 years of blogging experience, specializing in creating engaging, well-researched, and reader-focused articles. She enjoys breaking down complex topics into clear, practical insights that help readers stay informed and make confident decisions.