Solar energy has revolutionized residential electricity management across the United States. Homeowners installing photovoltaic (PV) systems generate their own clean power, slashing utility bills, hedging against rate increases, and gaining energy independence.
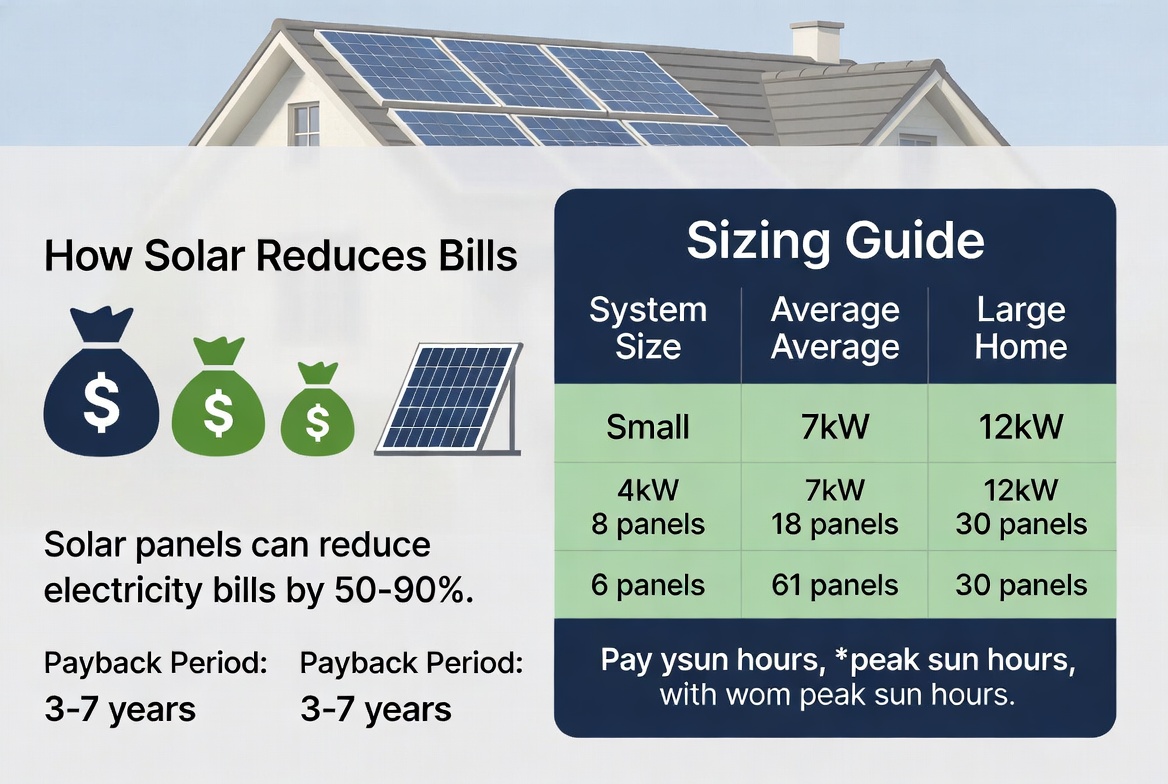
This comprehensive guide details how solar impacts electricity costs, factors for system sizing, recommended kW capacities for various home types and regions, precise calculation methods, real-world savings examples, return on investment (ROI), payback periods, and key considerations tailored to the US market. Data draws from sources like EnergySage, NREL, and EIA for accuracy and relevance.
1. How Solar Power Reduces Electricity Bills in the US
Solar panels on rooftops or ground mounts convert sunlight into DC electricity, inverted to AC for household use. Any surplus is exported to the grid, often through net metering or net billing programs, generating credits on utility bills.
Core Savings Mechanisms:
- Direct Self-Consumption: Daytime solar production powers lights, appliances, air conditioning, water heaters, and EV chargers, directly displacing purchases from the utility.
- Net Metering/Net Billing: Most states credit exported kWh at retail or near-retail rates (though policies vary, e.g., California’s NEM 3.0 uses lower export compensation). This turns your meter backward or provides bill credits.
- Peak Demand Alignment: Solar output peaks midday when many homes run AC or other loads, optimizing offsets.
- Protection from Rate Hikes: US electricity rates have risen steadily; solar locks in near-zero marginal cost energy after installation.
- Quantified Impact: A typical residential solar system saves homeowners between $41,000 and $155,000 over 25 years, depending on location, system size, electricity rates, and incentives. Higher-rate states like California, New York, and Massachusetts see the strongest savings.
Without solar, a household pays the full retail rate (national average around $0.16/kWh, but varying from $0.10 in some states to over $0.30 in others). With a well-sized system, effective electricity costs can drop 50-100%, often resulting in $100–$300+ monthly savings.
2. Key Factors Determining Solar System Size and Bill Reduction Effectiveness
No universal “one-size-fits-all” exists. Sizing depends on:
- Annual Electricity Consumption: From utility bills, in kWh. This is the primary driver.
- Solar Resource (Peak Sun Hours): Varies significantly—5.5–6.5+ in sunny Southwest states (Arizona, California, Nevada); 3.5–4.5 in cloudier Northeast or Pacific Northwest.
- Panel Specifications: Common 350–450W panels. Higher-efficiency models (e.g., 20–23% efficient) produce more per square foot.
- Roof Characteristics: Available unshaded south-facing space, pitch, and orientation. East/west orientations work but yield 10–20% less.
- System Derating/Losses: Typically 15–25% from inverters (~96–98% efficient), wiring, soiling, temperature, and snow.
- Future-Proofing: Account for EVs, home electrification, battery storage, or growing family needs (+20–50% headroom recommended).
- Local Incentives and Policies: Federal Investment Tax Credit (ITC), state rebates, SRECs, and net metering rules heavily influence economics.
- Shading and Microclimate: Trees, chimneys, or nearby buildings can cut output dramatically; use tools like Google Project Sunroof for assessment.
Basic Sizing Formula: System Size (kW) = Annual kWh Usage / (Annual kWh Production per kW in your location)
Or daily: (Daily kWh × 1.2–1.3 for losses) / Peak Sun Hours.
Production ratios (kWh per kW installed annually) range from ~1,000–1,600 depending on state.
3. Average US Household Electricity Consumption
The US Energy Information Administration (EIA) reports average household consumption at about 10,500 kWh per year (~875 kWh/month). Usage varies widely:
- Low-usage homes (efficient apartments, mild climates): 5,000–8,000 kWh/year.
- Average single-family homes: 9,000–12,000 kWh/year.
- High-usage homes (larger footprints, heavy AC, pools, EVs, electric heat): 15,000–30,000+ kWh/year.
Regional differences are stark: Southern homes use more due to cooling; Northeast homes less overall but may have heating loads. Apartments generally consume far less than detached homes. Daytime-heavy loads (remote work, pool pumps) maximize solar value.
4. Recommended kW Solar System Sizes for Different US Homes
Small Homes or Apartments (Low Consumption, e.g., 1–2 Bedrooms, <8,000 kWh/year):
- Recommended: 3–6 kW.
- Panels needed: Roughly 8–15 (using 400W panels).
- Examples: Efficient condo in California or Florida might need only 4–5 kW for near-full offset. Roof space: 150–300 sq ft.
- Bill Impact: 70–100% reduction possible with good sun exposure. Ideal for budget-conscious or space-limited households.
Medium Family Homes (3–4 Bedrooms, 8,000–15,000 kWh/year):
- Recommended: 6–10 kW (the most common residential range).
- Panels: 15–25.
- Examples: Typical suburban home in Texas or Arizona: 7–8 kW. In lower-sun states like New York or Washington: 8–10 kW.
- Suited for families with central AC, multiple refrigerators, electronics, and occasional EV charging.
Large or High-Consumption Homes (5+ Bedrooms, Pools, EVs, All-Electric, >15,000 kWh/year):
- Recommended: 10–20+ kW.
- Panels: 25–50+.
- Examples: Large Southern home with pool and EV: 12–15 kW or more. Whole-roof arrays are popular for maximum offset and export credits.
By Approximate Home Size (using 400W panels):
- 1,000 sq ft: ~8 panels (3–4 kW)
- 1,500 sq ft: ~12 panels (5 kW)
- 2,000 sq ft: ~16 panels (6–7 kW)
- 2,500 sq ft: ~20 panels (8 kW)
- 3,000+ sq ft: ~24+ panels (10+ kW)
With Battery Storage: Oversize the array by 20–50% (e.g., 10 kW panels on a 7–8 kW inverter) to charge batteries for evening or backup use. Popular in outage-prone areas or with time-of-use rates.
State-Specific Adjustments:
- High-sun states (CA, AZ, TX, FL, NV): Smaller systems suffice due to excellent production ratios.
- Moderate (CO, NC, GA): Standard sizing.
- Lower-sun (NY, MA, WA, IL): Larger systems or high-efficiency panels to compensate.
Many utilities cap system size at 100–120% of historical usage to prevent over-export.
5. Step-by-Step Calculation with US Examples
Detailed Process:
- Collect 12 months of utility bills and sum total kWh. Divide by 12 for monthly average.
- Convert to daily: Monthly average ÷ 30–31.
- Add buffer: +20–30% for future loads or inefficiencies.
- Determine local production factor via NREL PVWatts calculator (accounts for address-specific sun, tilt, etc.).
- Calculate kW: Adjusted daily kWh ÷ (Peak Sun Hours × 0.75–0.85 efficiency).
- Determine panel count: System kW × 1,000 ÷ panel wattage.
- Assess roof: Allow ~15–20 sq ft per panel plus spacing.
Example 1: Average US Home (10,500 kWh/year, California-like 1.5 production ratio):
- Daily need: ~29 kWh.
- Required system: ~7–8 kW (16–20 panels). Can offset nearly 100%.
Example 2: High-Use Florida Home (18,000 kWh/year with pool/AC):
- Target 10–12 kW system for full coverage plus export.
Example 3: Northeast Apartment (6,000 kWh/year):
- 4–5 kW system delivers strong ROI despite fewer sun hours.
Professional installers use detailed modeling including shading analysis.
6. Costs, Incentives, Savings, and Payback in the US
Installed Costs (2026): Average $2.50–$3.50 per watt before incentives. A 7–12 kW system typically $20,000–$40,000 gross, often $15,000–$30,000 net after federal ITC (30% tax credit).
Annual Savings: $1,000–$3,000+ common, scaling with system size and local rates. A system producing 10,000–12,000 kWh/year in a $0.18/kWh area saves ~$1,800–$2,200 annually.
Payback Periods: Typically 6–10 years nationally. Shorter (5–7 years) in high-rate sunny states with strong incentives; longer (9–14 years) in lower-rate or lower-sun areas. After payback, 15+ years of nearly free electricity.
ROI Enhancers:
- Federal ITC and state programs (e.g., rebates in NY, MA).
- SRECs in certain markets.
- Financing options: Loans, leases, PPAs with low/no upfront cost.
- Increasing rates and battery add-ons for time-of-use optimization.
- Minimal maintenance: Occasional cleaning; 25–30 year warranties on panels (80–90% output at year 25).
Oversized systems can accelerate payback via greater exports in favorable net metering states.
7. Challenges, Best Practices, and Additional US Considerations
- Intermittency: Pair with batteries (e.g., Tesla Powerwall) for backup and higher self-consumption, especially valuable in hurricane or winter storm zones.
- Policy Variability: Net metering rules differ by utility/state. Check databases like DSIRE.
- Installation Quality: Hire NABCEP-certified installers. Site surveys are essential.
- Permitting and HOAs: Local rules, setbacks, and aesthetics matter. Many states streamline solar permitting.
- Environmental and Resilience Benefits: Reduces carbon footprint; provides power during grid outages when paired with storage.
- Oversizing Considerations: Beneficial for future needs but watch utility export limits. A 10 kW system is suitable for larger homes without being excessive.
Ground-mounted or carport systems are alternatives for shaded roofs.
8. Real-World US Case Studies
- California Suburban Home: 7.3 kW system offsets average usage; strong savings despite NEM changes.
- Texas Large Home: 10 kW+ handles high cooling loads and potential EV charging with excellent payback due to abundant sun.
- Northeast Family Home: 8–10 kW system with batteries provides resilience and offsets winter heating spikes.
- National trends show most systems sized 6–12 kW deliver compelling economics, with whole-roof installations maximizing benefits in supportive states.
High-consumption households (EVs, pools, all-electric) achieve the largest absolute dollar savings.
9. Future Outlook and Actionable Advice for US Homeowners
Solar costs have plummeted, with continuing efficiency gains in panels, inverters, and storage. Federal policies, state goals (e.g., California’s solar mandates), and utility programs drive adoption. Emerging trends include virtual power plants, community solar, and AI-optimized systems.
Practical Steps:
- Review recent utility bills and use EnergySage or PVWatts for estimates.
- Obtain 3+ quotes from reputable local installers.
- Prioritize high-quality Tier-1 components.
- Evaluate battery add-ons based on outage risk and rate structures.
- Time installation to maximize ITC and before potential policy shifts.
- Consider energy efficiency upgrades first (LEDs, insulation, efficient appliances) to right-size the solar array.
Final Verdict
In conclusion, solar profoundly lowers US electricity bills by offsetting consumption at the source and leveraging credits. For an average home, a 6–8 kW system is often ideal; smaller for efficient dwellings, larger for high-demand properties. Customized sizing via professional assessment ensures optimal economics. With 25+ year lifespans and strong incentives, solar represents one of the best home investments available—delivering clean energy, substantial savings, and resilience for decades.
Homeowners across sunny and moderate-sun states alike benefit enormously. Assess your specific usage and location today to determine the right kW capacity and start your solar journey.

Seraphina Vale is a passionate content writer and blogger with 3 years of blogging experience, specializing in creating engaging, well-researched, and reader-focused articles. She enjoys breaking down complex topics into clear, practical insights that help readers stay informed and make confident decisions.